Microsoft Dynamics 365 Business Central (BC) is a comprehensive, cloud-based ERP solution designed for small and medium-sized businesses that has seen a rapid growth in adoption across the industry in the last few years. Just within Adaptiv’s customer base, we’ve seen multiple implementations of Business Central, which naturally prompted us to explore how to maximise the value of this data. While Business Central offers built-in reporting solutions and native connectivity to tools like Power BI, building a centralised data mart on a dedicated platform would expand the reach of this data, and enable “Self-Service Analytics” across the organisation.
This article introduces Adaptiv’s solution accelerator for Business Central analytics, harnessing Databricks’ integration and data processing capabilities. Read on to see how, in under a week, your Finance teams can derive better value and insights from Business Central. Over the next few sections, we explore the various components that combine to create the accelerator.
Environment Setup
A good foundation is fundamental for every data and analytics project. The solution is designed to be modular and fully customisable. While it can be plugged into an existing Databricks platform, as part of the setup, we also offer building out a Databricks application landing zone that takes care of all the necessary underlying infrastructure needed. The environment is built conforming to Microsoft’s Cloud Adoption Framework and covers network security elements such as firewalls and private endpoints. The landing zone also sets up the Databricks metastore and Unity Catalog–enabled workspace. All deployments are through Infrastructure-as-code (IaC) orchestrated through DevOps pipelines and version-controlled through a Git provider of choice. Read more about setting up Databricks on our article on Asset Bundles. Assuming standard practices and networking protocols, we estimate this phase to take about a day. This, of course, depends on the complexity of the existing Azure platform.
Data Integration
With the Databricks environment set up, the first step here is an obvious one: importing data from Business Central to our data storage. As an integration task, this is something that can be done with any integration platforms available such as Boomi or even Azure Data Factory. However, the solution comes with a set of comprehensive Python-based workflows that can be leveraged to minimise footprint. Business Central exposes data through a set of OData API endpoints and we focus only on the out-of-the-box entities that come as part of a standard BC implementation. Regardless of the method of integration, they all would need to follow a common design pattern:
1. An initial “Full-Load” from Business Central to capture historical data from a set point in time.
2. Record execution timestamp against each company/entity to serve as a watermark.
3. Subsequent “Incremental” loads that query the source APIs based on the watermark to retrieve records added or updated since the last run.
These steps ensure that the integration runs are idempotent, meaning the results will always be as expected and unchanged, no matter how many times the integration is run. This is a frequent concern with incremental loads when addressing integration failures and recovery.
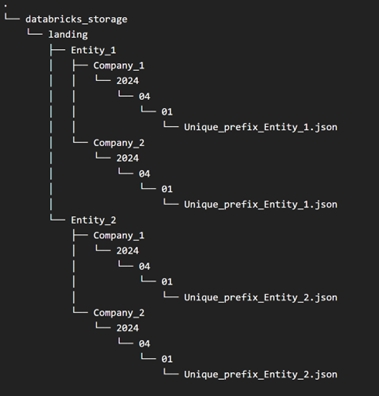
The raw data is stored on an ADLS gen2 account following a partitioning strategy as described in Figure 1.

Figure 1 Storage partitioning strategy
Figure 2 below shows a sample set of entities as orchestrated through Databricks workflows.

Figure 2 Data integration using databricks workflows
Data Transformation
Now that we have the raw data available, the next task at hand is transforming and curating the data to build up our data warehouse. We achieve this using Databricks’ Delta Live Tables (DLT) and the medallion architecture. These provide a framework to define and move data from their raw “bronze” form, apply any transformations and rules in the “silver” layer, and move data all the way to their final presentation-ready “gold” versions. The general steps of the transformation process include:
- Setting up a global “date” table to serve as a date dimension across the Enterprise Data Warehouse (EDW).
- Apply cleaning and transformation rules to incoming data to format fields and create calculated fields.
- Set up quarantine rules and tables to catch any exceptions that might pop up in the source data, giving the business an opportunity to fix them in the source.
- Define any history tracking requirements and create Slowly Changing Dimensions (SCD) Type 1 and Type 2 tables as necessary.
- Create and load into final dimension and fact tables to build the presentation layer.
Through the data transformation journey, the solution accelerator handles the table definitions and any metadata necessary. The solution also sets up prefixes to indicate the source system and the layer of transformation a particular table belongs to. Read our articles on date dimensions in Databricks SQL and metaprogramming to learn more about processing a large number of tables across the bronze and silver layers using DLT. Figure 3 below shows a small section of the DLT pipeline that processes and tracks lineage from the raw data to the presentation layer.

Figure 3 Sample DLT pipeline for ELT
Assuming minor customisations, we estimate the data integration and transformation phases to take a maximum of three days.
Data Presentation
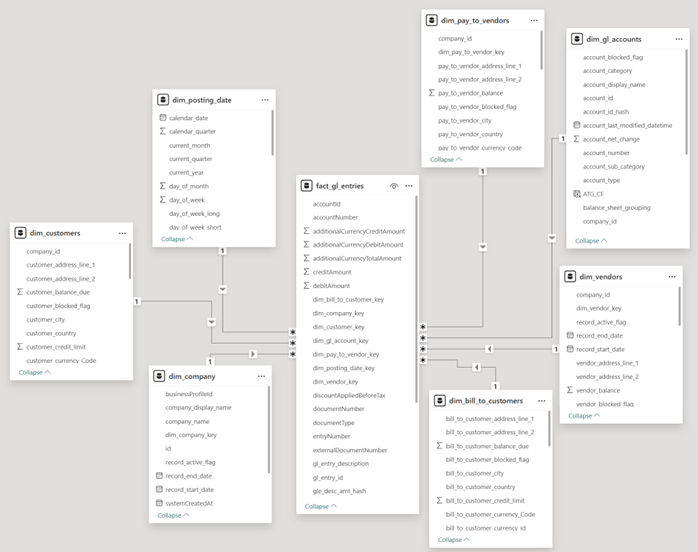
With all data transformation and loads done, the final step in this process is setting up a data model and reporting layer. Databricks supports a wide array of reporting platforms, with our personal favourite being Power BI. A sample data model from the process above is shown in Figure 4. The tables shown below are indicative of the “gold” presentation layer created in Databricks and in this case, aim to help accelerate creating balance sheet reports and reconcile Sales and Purchase invoices. This is, of course, only a sample to serve as an indicator of what kind of reporting and slicing/dicing this data model offers and can be fully customised.

Figure 4 Power BI data model (star schema)
Look out for our article on Databricks’ new feature on Power BI integration – a feature that speeds up the presentation layer by automatically picking up relationships between tables and building a Power BI model straight out of Unity Catalog.
In this last leg, we aim to spend a day or two working with SMEs and stakeholders within the business to identify reporting requirements and train users to use the model above in a self-service capacity.
The Databricks Advantage
The burning question now is – Why do all this? The answer to this boils down to what Databricks as a platform offers – A one-stop solution for all modern enterprise data needs. Databricks provides an easy-to-use abstraction layer over the behemoth that is Apache Spark. With features like Workflows and Delta Live Tables, Databricks allows organisations to accelerate building solutions and start generating insights by only writing standard SQL. Couple this with Serverless compute, and you now have a data platform where you don’t have to worry about tasks like tuning and upgrading Spark clusters, enabling your analysts to focus their time on solving actual business problems.
It does not stop there, however. Databricks still provides a best-in-class data platform and options to customise that can easily scale to every organisation’s needs, and mobilise roles such as Analytics Engineers, Data Engineers, and AI/ML Engineers.
Conclusion
To summarise the wall of information above, here at Adaptiv, we place an emphasis on a few key areas:
- Set up an Azure Databricks platform that follows Microsoft’s Cloud Adoption and Well Architected frameworks.
- Robust integration pipelines for incremental data loads, with options to change the integration frequency as required by business needs.
- Metadata and log driven integration that allow easy error handling and pipeline recovery.
- Accelerate creation of bronze layer table and managing slowly changing dimensions, so you can spend more time focussing on the data model.
- End-to-end data lineage and access control through Databricks’ Unity Catalog.
- Data governance and democratisation – users have access to the data they need, governed, and endorsed through a central process.
The solution accelerator we’ve described in this article achieves all this through code, deployment, and data platform best practices. A centralised data repository can enable traditional report consumers to become “citizen developers” and empower them to do more with their data, while guaranteeing a Single Source of Truth. We have witnessed firsthand how power users within the business start exploring Business Central data through the conformed Silver layers described above. Not only does this lead to improved visibility and governance, but it also opens up new avenues for insights and analytics.
The solution is also designed to be modular and is built with the fundamental idea of decoupling the integration, storage, and data transformation layers. This allows for each layer to be handled individually with no dependency on the others and enables event-driven data processing. While we’ve used Business Central as an example here, the solution can be customised to work with any other API data sources or external integration tools such as Azure Data Factory, Boomi, MuleSoft etc.
To find out how we can help build or improve your Azure Databricks platform and support you on your Data & Analytics journey, get in touch with us today to speak to our Azure, Databricks, and integration experts.


