
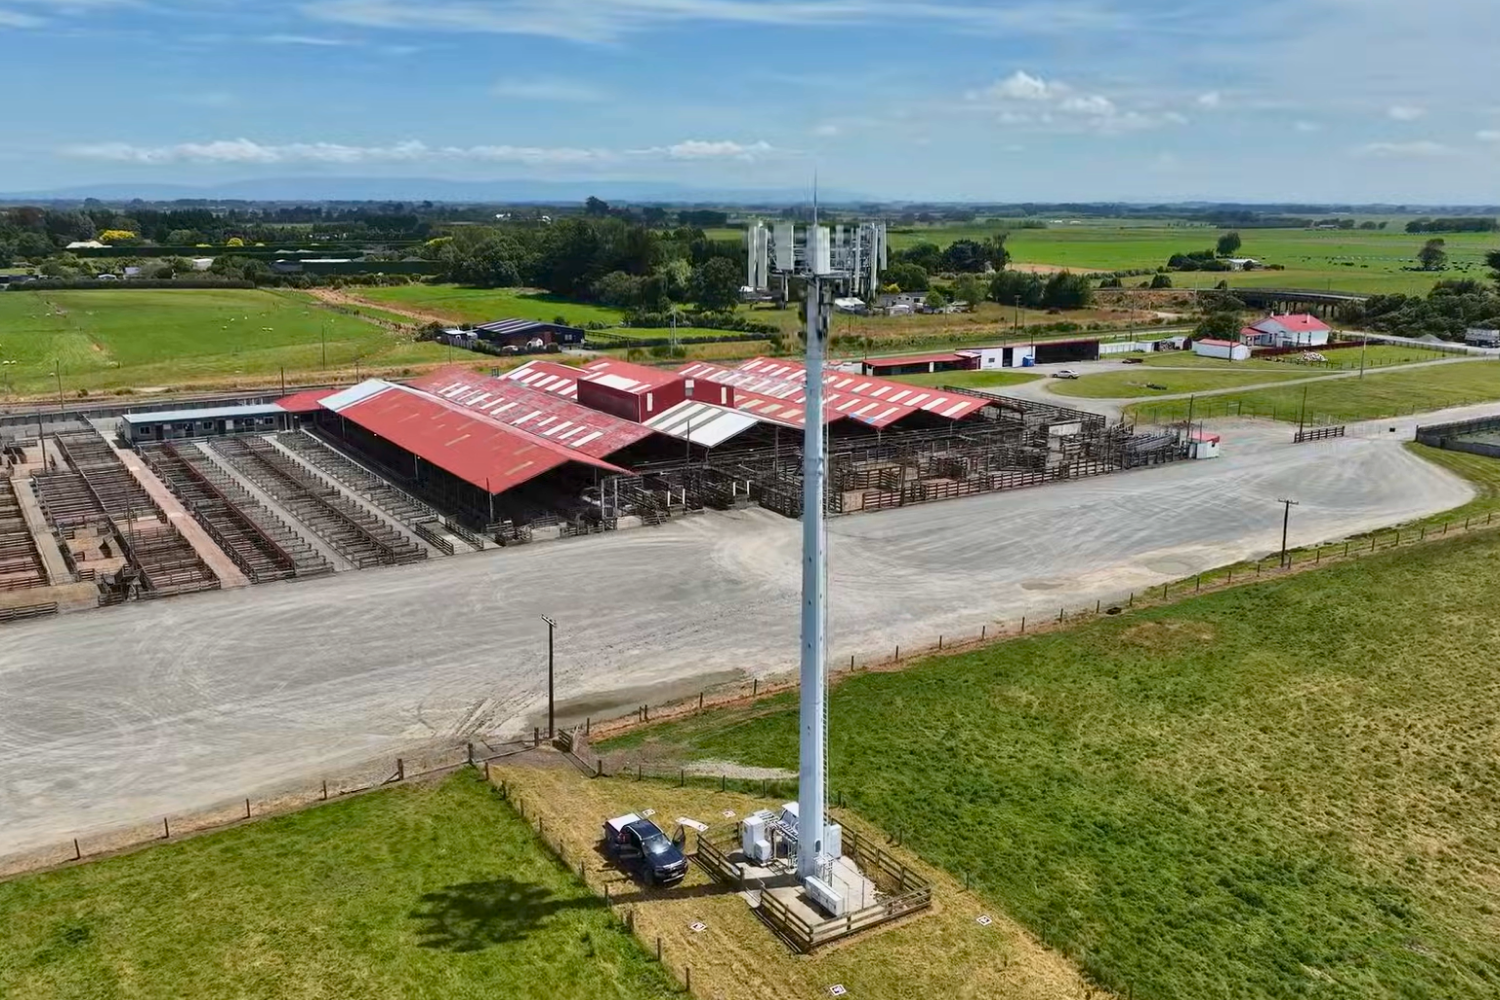

Fortysouth owns and operates around 1,700 mobile towers, carrying connectivity to 98% of New Zealand’s population. It is one of the country’s newest infrastructure businesses, and one of its most ambitious. In August 2026 it was named winner of the Innovation Leadership Through an Emerging Technology award at the New Zealand CIO Innovation Awards for its AI-enhanced digital twin of the tower network.
Behind that ambition sat a less visible problem. Fortysouth’s operating spend report still started in Excel. Financial figures came out of one system, site and lease details came out of another, and someone mapped and reconciled the two by hand before anyone could read the result. Capital expenditure reporting worked the same way.
For a business planning to run on data, the foundations had to change. Fortysouth brought in Adaptiv to help it build them. Today, reporting that once took days of manual work is ready in minutes, and Finance, project teams and the board all work from the same numbers.
A business that started with a blank sheet of paper
Fortysouth was formed when it acquired One New Zealand’s tower network. It began life with no technical systems of its own, which gave the leadership team a rare opportunity to design its architecture from the ground up.
“When we started Fortysouth, we actually started with a blank sheet of paper. We didn’t have any technical systems, and so we really needed to think about how to keep our architecture clean and pure.”
Jo Stansfield
Chief Technology Officer and Chief Operating Officer, Fortysouth
The business moved quickly. Business Central became the financial system of record, set up for statutory reporting. SiteTracker held site, project and lease information. Databricks and Power BI were in place for analytics. Each system did its job, but the logic behind a single management figure could sit in any of them, or in a spreadsheet between them.
“Previously, if you asked 10 people the same question, you probably would have got 10 different answers.”
David Allemann
Head of Digital Platforms, Fortysouth
That was the trigger for Fortysouth’s Data Excellence Programme.
From data strategy to delivery in one continuous programme
Fortysouth first asked Adaptiv to assess where its data and analytics capability stood and where it needed to go. Adaptiv’s Data Strategy reviewed the Databricks and Power BI estate alongside the way Finance and operations teams used data day to day.
The recommendation was to strengthen the existing platform, not replace it. The strategy set out a small number of principles that would guide every decision that followed. Source systems stay authoritative. Logic is transformed once and reused everywhere. Business definitions have business owners, so Finance owns financial definitions and each system owner is accountable for the quality of their own data.
Adaptiv’s CTO and co-founder, Nikolai Blackie, describes the intent behind the engagement.
“We weren’t just connecting systems, we were establishing the data foundations for an information-led business.”
Nikolai Blackie
CTO and Co-Founder, Adaptiv
The strategy moved straight into a Data Excellence and Power BI engagement that ran for about three months and put that direction into production.
Rebuilding the engine room
Adaptiv’s review, led by Data Practice Lead Leighton Gosnell, found a Databricks implementation that worked, but had grown quickly and not yet caught up with best practice for running safely at scale. Development and production shared one environment. Ingestion ran as large, repeated blocks of code. Parts of the solution had not yet moved to dedicated service accounts, and much of the knowledge about how it all fitted together sat with a few people.
A complete management view also needed Business Central and SiteTracker data processed together, and the existing setup made that unreliable.
“They had a circular dependency that was causing failures and unreliable results, so we restructured the order everything runs in to remove that.”
May Tun
Data Engineer, Adaptiv
With the run order fixed, the Adaptiv team rebuilt processing around a single daily schedule and separated development from production. Service accounts replaced personal credentials. A curated reporting layer now holds clean, joined data across operating and capital spend, purchasing, projects, leases, fixed assets, sites and revenue. Budget and forecast figures, previously handled manually, now load automatically from the planning files Finance already maintains in SharePoint.
Fixing the process behind the report
As the new reports took shape, some of the problems turned out to sit further upstream, in source processes and classifications. Because Business Central had been structured for statutory requirements, management categories had been layered on later, often in spreadsheets. Rebuilding that logic inside Power BI would have produced better-looking reports with the same fragility underneath.
Instead of patching the reports, the Adaptiv team went back to the people who produce and use the numbers, from the executive to the finance and project teams.
“One of the advantages of working on a top-down, bottom-up approach meant that we could get a really good understanding of the processes right through the entire business. What that meant was we were able to shape the technology to support those.”
Leighton Gosnell
Data Practice Lead, Adaptiv
Fortysouth’s Finance team made the harder call and changed its processes. Corrections and reusable management classifications moved back into Business Central, so each rule is defined once and flows through Databricks into every report that uses it. Where source data is still incomplete, the reports now surface the gap and make it traceable, instead of hiding it behind report logic.
Reporting that took days now takes minutes
Before the programme, producing Fortysouth’s core finance reports meant days of extracting, mapping and reconciling data by hand. With the curated layer in place and the logic moved back to source, the same reports are now ready in minutes. One known process that needed about three hours of preparation and updating now runs in around 20 seconds.
The reports went live through the Fortysouth Reporting Hub, a single entry point for six reports covering operating expenditure, capital expenditure, cost to build, maintenance, leases and the operating model.
Speed only matters if people trust the result. Every Power BI measure is documented back to curated tables in Databricks, and Databricks lineage traces those tables to source. Reports refresh daily, with alerts if a refresh fails. Access is managed through security groups, with row-level security where a report needs it.
Visibility the business never had before
The cost to build report combines actual project spend with open purchase order commitments, broken down by site and tower type and compared against budget and recent builds. For the people delivering new towers, that view did not exist before.
“A project manager can now look at a project and see all costs related to that work. We’ve never had that visibility before. As a project manager, trying to manage a project without the visibility of your costs is like having one arm tied behind your back.”
David Allemann
Head of Digital Platforms, Fortysouth
The effect reaches well beyond project teams. With one version of the numbers, conversations about performance have changed at every level of the business.
“The way we’ve gone about implementing and thinking about our data has enabled us to have much stronger conversations, not just at the board table or with the executive, but actually with our people.”
Jo Stansfield
Chief Technology Officer and Chief Operating Officer, Fortysouth
A foundation built to grow with Fortysouth
The platform is in production, backed by a 12-month support agreement with Adaptiv covering changes, incidents and further improvements. When Fortysouth’s operating model changes, the agreed approach is to make the change in Business Central first and let it flow through Databricks into Power BI, keeping the source of truth intact.
The next stage is already mapped out: stronger reconciliation and data-quality checks, measuring how the reports are used to decide where to invest next, and self-service and natural-language analytics once definitions and access controls are mature enough to support them.
Fortysouth set out to build a modern infrastructure business from a blank sheet of paper. Its finance and operations teams now work from one set of numbers they can trust, and when a figure looks wrong, they can trace it straight back to where it started.